#3) RSI (Relative Stregnth Index)
No trading system can rely only on the RSI indicator, but should be used in combination with other indicators or price action. The RSI can give you an edge in your spread betting technique. Before attempting this strategy, read The RSI: The Relative strength article.
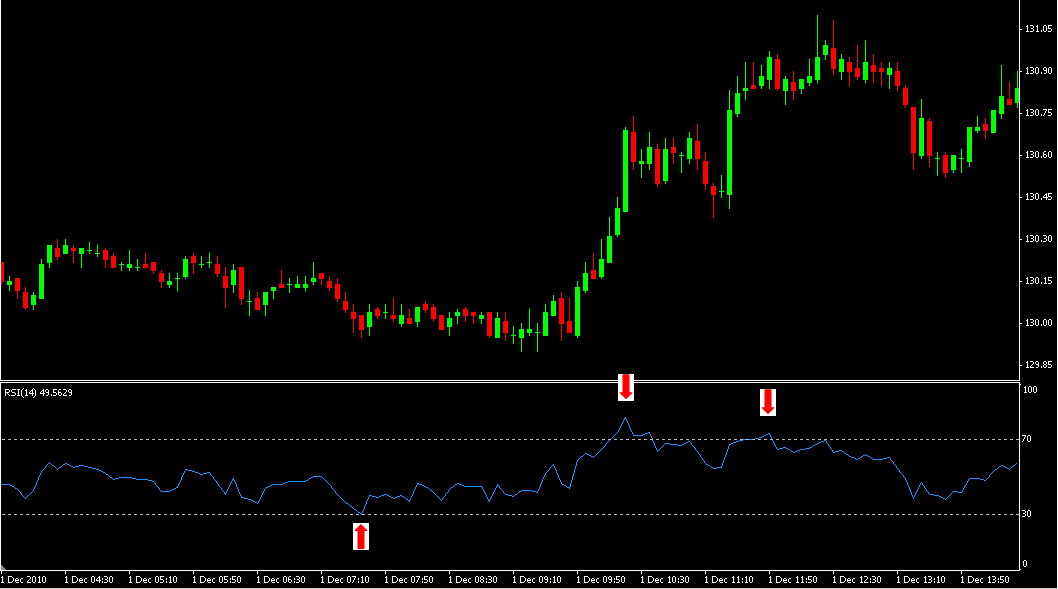
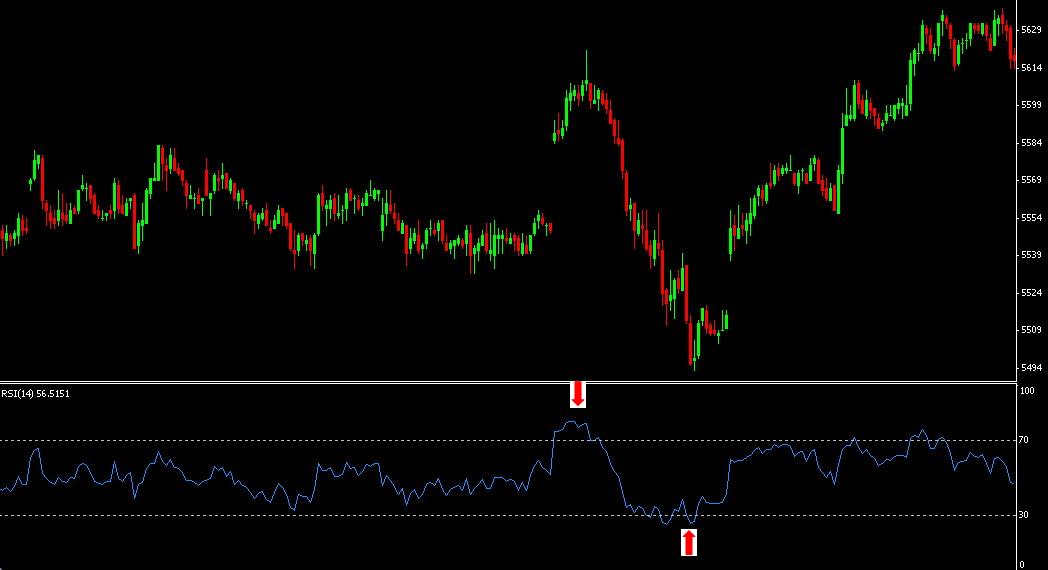
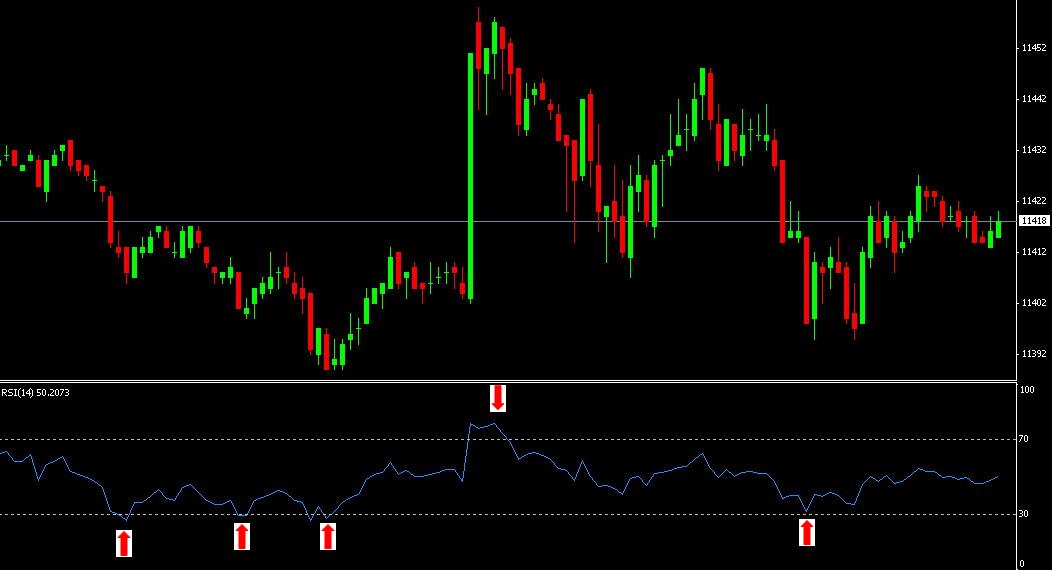
We set the RSI at a period of 14 and monitor the levels 70 and 30.(The RSI is an Oscillator and above 70 indicates that the prices are overbought, below 30 indicates that the prices are oversold).
Entry rules: Buy when the RSI crosses below 30, forms or has formed a bottom, and then crossed back up through 30.
Sell when RSI has crossed above 70, formed a peak, and then crossed back down through 70.
Exit rules: not set. Or use your money management
Advantages: RSI is a very good indicator to refer for confirmation when you are ready to enter a trade in any simple or complex trading system. Best used when trying to trade in a contratrend or or range trading market. In a trending market the RSI, can give false signals.
Disadvantages: You need to monitor your trade, as the RSI alone can give false signals when the market is trending. The RSI Oscillator should be used in combination with other indicators.
Financial Spreadbetting techniques and Tips on how to use the RSI: